The lengthscale over which dissolved metals in the deep sea are transported is principally a function of the ratio between the residence time of a metal tM to the mean "age" tW of a deep water mass following its formation and incorporation of the respective metal. For example, the dissolved concentrations of elements or isotopes for which tM < tW, where the maximal tW ª 1500 a for old N Pacific deep water from 14C ages, will be governed by the regional input fluxes. One such example is Pb, because tPb ª 100a. By comparison the advection length scale of 10Be (t10Be @ 600a) or Nd
(tNd ª 1500a) is less restricted and transport of isotopic signals with water masses over basin scales is expected.
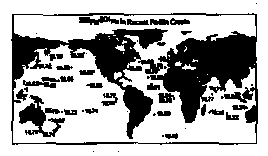
Worldwide mapping of deep seawater isotopes, from water samples or from marine authigenic Fe-Mn crusts reveals that Nd of N Atlantic provenance is tranported with NADW into the deep Pacific (Jones et al., 1994). In contrast, no Atlantic signal of Be reaches the Pacific, although the ratios of cosmogenic10Be to terrigenously sourced 9Be vary significantly between the oceans (4 ¥ 10-7 in the N Atlantic, 1.2 ¥ 10-7 in the Pacific) (von Blanckenburg et al., 1995). Pacific 10Be/9Be ratios are relatively uniform, because dissolved 9Be concentrations are constant (Kusakabe et al., 1990), and any cosmogenic 10Be, arriving in the Pacific through rain or by advection is removed into the sediment and replaced by fresh 10Be before it can accumulate, thereby maintaining constant dissolved 10Be concentrations. New Pb isotopic compositions from dated surface layers of the same Fe-Mn crusts as those measured for Be (von Blankenburg et al., 1995) is shown below. As expected, the uniform Pacific 206Pb/204Pb ratios fail to reveal any Atlantic influence. Advection of Pb is only visible in the SW Atlantic, where, in agreement with Be and Nd isotopes, Pacific-like ratios are observed. This may be caused by rapid flow of Pacific Deep Water through the Drake Passage into the SW Atlantic (Abouchami and Goldstein, 1995).
The differences in advection lengthscales have important implications for the use of these isotopic systems as paleoceanographic tracers. 143Nd/144Nd in Fe-Mn crusts of the Central Pacific have a pronounced isotopic structure at 3-5 Ma as well as longer term structure and appears to record adjustment of water mass movements to paleoceanographic changes - particularly the Panamanian gateway, and the Drake Passage (Ling et al., 1996). Pb isotope variations from the same samples (Abouchami and Goldstein, 1995) do not show comparable structure at 3-5Ma as "seen" by Nd, and any variations record changes in the local provenance of the Pb. Initial 10Be/9Be from the same samples (Ling et al., 1996; Segl et al., 1984) appears to have been constant back through the last ~ 6Ma. Because any change in the terrigenous source can only be reflected in abundance variations of 9Be, the provenance variations visible in 206,207,208Pb/204Pb do not affect Be in the same way. Furthermore, the response of isotopic signals to paleocirculation changes, as shown by 143Nd/144Nd, are absent for Be due to the exchange of Be at tW > t10Be. Rather the constant 10Be/9Be ratios back through time reflect a constant balance between terrigenous 9Be and cosmogenic 10Be input into the deep ocean, unmodified by the adjustments to ocean circulation.
Abouchami, W. & Goldstein, S.L., Geochim. Cosmochim. Acta 59, 1809-1820 (1995).
Jones, C.E. et al., Earth Planet Scie. Lett. 127, 55-66 (1994).
Kusakabe et al., Geochem. J. 24, 263-272 (1990).
Ling, H. et al., J. Conf. Abs. 1, 342 (1996).
Segl, M. et al., Nature 309, 540-543 (1984).
von Blanckenburg, F. et al., in prep. and Terra Abstracts, Supplement to Terra Nova 7, 22 (1995).
Fig. 1.