Some remarkable diamonds collected from the George Creek kimberlite dyke, Colorado, preserve complex
intergrowth textures between two major growth generations
(A and B) with distinctive cathodoluminescence (CL) and other characteristics (Chinn, 1995).
(A) Diamond with anomalous pink or yellow CL. This is relatively homogeneous in CL, with no evidence of growth zonation or plastic deformation. FTIR studies indicate the presence of CO2 inclusions.
(B) Diamond with blue-green CL. This either preserves undeformed complex growth zones or closely-spaced slip planes that largely obscure any growth zonation and give rise to yellow stripes in CL. No CO2 has been detected in this diamond generation.
Plates cut from three of the George Creek stones (GC8, GC30 and GC42, where 8 and 30 contain both types of diamond, but 42 only has type B) have been analysed for carbon isotope composition and nitrogen content by secondary-ion mass spectrometry (SIMS) using the CAMECA ims-4f ion probe at the University of Edinburgh. The analytical technique for carbon was described by Harte and Otter (1992), and nitrogen abundance was measured using the ratio of 12C14N- ions to 13C-, working at high mass resolution (Dm/m~7500) to distinguish 12C14N- from 13C2-. Analysis pits were 10-40 µm in diameter.
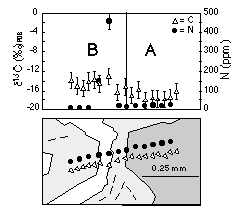
The carbon analyses span a range of 0 to -20” with a typical analytical uncertainty (1*) of ±1.5”. Nitrogen contents vary between 0 and 750 ppm with relative errors (1*) of about ±10%. Carbon isotope compositions and nitrogen contents for the diamond generations in each plate are summarized in Table 1. Figure 1 shows a typical analytical transect crossing the boundary between type-A diamond with homogenous yellow CL colours (dark grey on plan view of Fig. 1) and type-B diamond comprising bright blue and dark green-blue growth zones in CL (white and light grey respectively in
Fig. 1).
It is clear that CL characteristics correlate closely with nitrogen content. Type-A diamond with homogeneous CL colours has relatively homogeneous and low nitrogen contents, whereas type-B diamond comprising growth zones with blue-green CL has a wide range of nitrogen contents reflecting the very high nitrogen content (100-500 ppm) of bright blue CL zones and the very low nitrogen content (0-20 ppm) of dark blue or green CL zones There is also a wider range of *13C ratios in type-B diamond than type-A diamond, but although different diamond generations typically have different carbon isotope compositions, there is no consistent correlation between *13C and CL colour or intensity.
Chinn, I.L., Unpubl. PhD thesis, University of Cape Town (1995).
Harte, B. & Otter, M., Chem. Geol. 101, 177-183 (1992).
Fig. 1: Bottom diagram shows the position of SIMS sputter pits relative to CL zones in plate GC30, and top diagram shows the corresponding C-N analytical data. Error bars are ±1*; and are smaller than the symbol size for most N analyses.