In order to determine salt effects on stable isotope
fractionation in aqueous systems, equilibrium fractionation factors for oxygen and hydrogen isotope exchange between aqueous salt solutions and co-existing vapour have been determined for a number of salts at 50°C and for oxygen isotope exchange between a 4m NaCl solution and its vapour up to 396°C.
In this abstract we adopt the convention of Horita et al. (e.g. Horita et al., 1995) where the salt effect G is defined as the ratio of the liquid-vapour equilibrium fractionation factor for pure water and that for the salt solution:
G = a1-v(water)/a1-v(solution).
At 50°C, an experimental setup similar to that of Horita et al. (1993) was used. 1000 ln G varies linearly with molality for all systems studied so far. The concentration dependencies molality 1000 ln G/for d18O are: NaCl, NaBr, NaI show essentially no effect; RbCl: 0.1; KCl: 0.14; KBr: 0.38; LiCl: -0.35; LiBr: -0.39; CaCl2: -0.36; MgCl2: -0.9.
So far, we determined 1000 ln G molality for dD at 50°C only for the following systems: NaCl: 2.2; NaBr: 2.9; and CaCl2: 4.2.
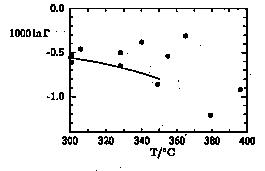
Salt effects of a 4m (= 18.9 wt. %) NaCl solution have been determined in a gold-lined hydrothermal apparatus using a static equilibration and a static sampling method. An advantage of this experimental approach relative to the dynamic sampling method of Horita et al. (1995) is the constant solution composition throughout the course of a set of experiments. Our preliminary data set between 301° and 396°C is plotted in Fig. 1.
The data between 328° and 365°C seem to indicate a slightly less dramatic increase of the salt effect then implied by equation (10) of Horita et al. (1995). Experiments using an improved experimental setup are currently being carried out in order to reduce the scatter in the data sets and hence better define the trends from 250° to approximately 410°C.
A short discussion of the possible implications of the experimental data for the understanding of the structure of aqueous solutions at elevated temperatures based on comparison with Molecular Dynamics simulations and Ab Initio calculations (Driesner et al., 1996) will be given.
Driesner, T. Tironi, I.G. & Seward, T.M., J. Conf. Abs. 1, 145 (1996).
Horita, J., Cole, D.R. & Wesolowski, D.J., Geochim. Cosmochim. Acta 59, 1139-1151 (1995).
Horita, J., Wesolowski, D.J. & Cole, D.R., Geochim. Cosmochim. Acta 57, 2797-2817 (1993).
Fig. 1: 1000 ln * for oxygen isotope fractionation between a 4m NaCl solution and vapour between 300° and 400°C. Solid curve: eq.(10) of Horita et al. (1995). Analytical error of individual data points is less than 0.15. By definition 0.1 in 1000 ln * is in a very good approximation equal to 0.1 in the *18O notation.